
Game, Set, Dash: Track your padel progress!

Padel, a mix between squash and tennis, was one of the most popular sports during the pandemic. While the headlines in 2020 still announced the arrival of the 100th padel club in Flanders, more than 300 clubs have sprung up from the ground. So, unlike the pandemic, padel is definitely here to stay!
The prevalence of padel is evident not only in the sheer number of competitive matches played throughout the year but also in the motivation to climb the rankings. It’s no surprise that players proactively gain insight in their opponents’ data, to assess their own chances of winning.
Well, is there a way to track your padel progress? 🤔
First things first: where can you already check out padel statistics?
Personally, I started playing padel towards the end of the pandemic, and I must admit that I’m one of those players who likes to have a proper indication of my odds before participating in a tournament. While websites like Padel Vlaanderen and initiatives like Padelstats provide initial insights into this data, as an Analytics consultant, I felt there was more to explore. Join me on my journey as I delve deep into the data to uncover these insights.
What would we like to find out?
When we start looking at the behaviour of a typical padel player, we see that there are 2 moments when a player is interested in accessing data:
1) Twice a year, a player’s padel ranking is recalculated based on his or her performance during the past six months. For padel, this happens once in December and once in June. Besides the interest in knowing whether your own ranking or that of a fellow player has risen, there are always some questions that players like to see answered. An example of these questions for which answers were sought are the following:
What is a player’s current ranking?
How has a specific player’s ranking evolved over time?
What is the distribution of all players by ranking and gender?
2) Before the start of a tournament, players tend to gain insight into their opponent’s performance. At this point, it becomes particularly interesting to assess whether an opponent has been on a winning streak. Essentially, one must ascertain if the opponent’s current ranking accurately reflects their performance or if they have ascended beyond their peers in the standings. Questions that currently come to a player's mind are the following:
What is a specific player’s win rate?
Which partner does a particular player achieve the best results with?
Does a player participate only in tournaments within their current ranking, or do they also compete in higher divisions?
It will be to all the above questions that we aim to answer via a visual dashboard in Power BI.
Where can we gather the data we need?
The data where all matches are recorded is on the website of Tennis and Padel Vlaanderen. Since it is currently not possible to access the data via API, the necessary data was extracted from the Tennis and Padel Vlaanderen website via web scraping. This whole analysis is based on data that is made publicly available.
To extract and model the data, the Microsoft Fabric platform was used. Microsoft Fabric is a set of Data Analytics components that allows you to put data in data lakes, allows you to write Python notebooks, provides you with a SQL Lakehouse and allows you to visualise your data in Power BI. We welcome you to look around our long list of blogs for more information about Microsoft Fabric.
Evaluation time!
Once the necessary data has been modelled and made available for Power BI, we can start creating a visual report to answer all our previous research questions. To give a clear overview of general insights and insights about players, two reports were created: the general report and the player statistics report.
General statistics
We start with a report that provides consumers with an overview of the number of active players and the distribution of the number of players by classification and gender to answer the next question:
What is the distribution of all players by ranking/gender?

Looking at the number of players, we see that, currently, there are 69,706 players playing padel competitively. If we are going to break this number down by gender, we see that there are 45,431 male padel players ranked P100 or above, whereas on the women side, 24,275 players are currently ranked. We get the competitive nature of a player from the player having a ranking.

That the sport of padel has yet to lose popularity can be seen as the number of players playing the game competitively continues to increase with each ranking.
One reason for this is certainly the numerous tournaments organised throughout Flanders. The popularity of inter-club competitions may also be a reason why many new players are entering the competitive side of the sport.
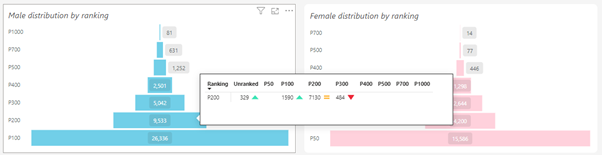
Examining the funnel chart, it’s evident that the number of players per ranking forms a pyramid shape, with the fewest players at the highest level and the most players at the lowest levels, namely P50 or P100.
If we hover our mouse over the funnel graph in the report, it is possible to see how the current ranking is structured compared to the previous ranking calculations. The tooltip shows how many players have risen, fallen or remained the same compared to the previous ranking calculation.
The reason Padel Flanders announces their criteria for moving up or down in ranking only at the end of the season is to ensure this pyramid shape is maintained. This becomes clear when we look at the distribution over the years.
Player statistics
To access a player’s current data, we’ve opted to compile all information about a player into a clear summary, on an individual basis. By searching for a player’s name (in this report, last name + first name), one can view various statistics. As an example, I’ve taken my own dashboard from the autumn season of 2023.

At the start of the autumn season in June, I was ranked P200. My personal goal was to rise to P300 by the end of the season’s ranking calculation, which I am proud to say I achieved. Here’s how I did it:
I participated in 6 tournaments, 4 of which were in my own ranking category and 2 in a higher category. (This is possible if you find a partner who has the required ranking or if you win a tournament in your current ranking).

Win rates are measured within the same ranking bracket.
From my matches in my own category, P200, I achieved a win rate of 70%. On the other hand, looking at my performance in the P300 ranking bracket, I ended up with a 40%-win rate. This tells me that I can compete well within my own ranking, but it gets a bit tougher at a higher level. It’s definitely positive to always have a challenge!
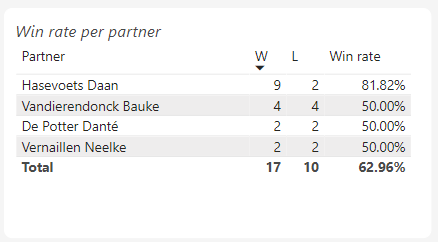
When I look at which partner I had the most success with, I can conclude that I played well with Daan Hasevoets. Which is not to say that I have not determined good results with my other fellow players. I also experienced fun and exciting matches with them!
The interclub field in this overview is empty since I didn’t sign up for the Mixed Padel Cup, which might just be a challenge for this year!
Excited to track your own padel progress?

The report has been publicly shared, allowing every reader to access it
How do you proceed?
1) Open the report by clicking the image above or by navigating to https://www.plainsight.pro/padel
2) Navigate to the “Player stats” report page.
3) Open the dropdown where you can select the player’s name.
To find your own name, enter your last name followed by your first name in the search field.

4) Last, you can use the season filter to select the desired season. If you want to select multiple seasons at once, you can do so by holding down the CTRL key and selecting several seasons.

After reviewing your own insights, are they as you expected, or were there any surprises?
What’s next?
While modelling and analysing the data, a multitude of possibilities emerged for further analysis and visualization. Therefore, the following cases could be explored:
1) Insights on upcoming matches
Which duo is the top contender in each group?
Based on past results, which duo is most likely to win the tournament?
...
2) General club statistics
The evolution of player numbers over time
If players leave a certain club, which other club nearby will they join?
…
Wrap up
In this blog, we’ve reviewed some basic metrics and visualizations to analyze the number of padel players in Flanders, but of course, this isn’t the only way to do it. If you have any questions about the architecture behind the setup or the calculation of certain metrics, feel free to contact me via email or LinkedIn. In the meantime, I’m happy to give you access to the Power BI report so you can view your own data. Enjoy your analysis!
👉 Do you have any questions or need help implementing this solution?
At Plainsight we are always in for a chat! ☕
Anxious to know what Plainsight could mean for you?
Read more “About us”
Consider “your career at Plainsight 🚀”